

Why NOT Reacting to Market Volatility Can Be the Best Reaction for Your Portfolio

Every day we share our thoughts and perspectives with clients about the markets—and, more specifically, what the latest market news means for them and their portfolios. Clients who have worked with us for a long time are familiar by now with our message during volatile times: Stay focused on your objectives. Resist the temptation to be reactive.
What do we mean by this? Let’s break it down.
Stay focused on your objectives. How you are invested should always be based on your objectives, timeframe, and risk tolerance regardless of what is happening in the markets. We design your asset allocation—i.e., the distribution of investments across different asset categories—based on your unique personal profile. If we use your objectives as our guide, you can feel confident that you are already in the best possible position if and when a market correction happens, at which point little or no adjustment should be required.
Resist the temptation to be reactive. History from past market corrections shows that the financial winners in the long run are those who sit tight and wait the turbulence out. Many an investor has regretted pulling out of the market in 2000, 2008 or 2020—only to miss out on the larger recoveries that followed.
We know it has not been easy these past weeks watching the news or seeing your portfolio decline and hope these words are reassuring if you’re feeling anxious or wondering if some kind of action is needed. You may also be interested in the analysis offered by Raymond James Chief Investment Officer Larry Adam, reprinted in full below (or click here to read online). In this latest report, he reinforces the case for patience and highlights some of the indicators he is seeing that may point to brighter days ahead. We have highlighted some key points that we feel are worth noting.
May 6, 2022
Take a Deep Breath and Focus on Fundamentals, says Raymond James Chief Investment Officer Larry Adam
Volatility is never comfortable, and this year is no exception. With the May 5 drawdown, the S&P 500 is down 13% year-to-date and near its lowest level since May 2021. Interestingly, despite the sharp gyrations throughout the week, the market is now at about the same level as at the beginning of the week. This is why it is important to put the recent volatility into context. Investors are trying to time the change in the inflation trajectory, Federal Reserve policy, China’s zero-COVID policy and the strength of the economy. But these changes tend to be slow developing and are nowhere near as reactive as the markets would have you believe. That is why we encourage investors not to watch and certainly not make investment decisions based on these daily headlines and sharp market moves.
S&P 500 – Price Index

Source: FactSet, 5/5/22
Case in point, the volatility and whipsaw nature of the market has seemed never ending, as the S&P 500 has moved over 1% in either direction in over 50% of the trading days year-to-date, including 14 trading days with over 2% moves. This week alone, investors saw back-to-back 3% moves. In fact, after Fed Chair Powell took a 75 basis point rate hike off of the table, the S&P 500 posted its best daily gain (+3.0%) since October 2020 and the 2-year Treasury yield saw its largest daily decline (-12 bps) since March 2022. But as investors have had time to digest Chair Powell’s commentary, the market completely reversed these moves. The S&P 500 is now lower than at the time of the Fed announcement and Treasury yields are well above May 5 levels.
Making matters worse, there are few places for investors to hide (commodities, specifically oil, being one), as the typically less volatile asset such as bonds (Bloomberg U.S. Aggregate Bond Index) are in the midst of the worst drawdown since the 1970s and bond yields continue to surge higher. The 10-year Treasury yield is now up about 160 basis points year-to-date to its highest level since November 2018. As a result, a typical 60/40 portfolio has posted the worst start to a year at this juncture since at least 1975.
There are a number of risks for the market and the near-term outlook remains cloudy as we await the resolution of the aforementioned issues. We continue to expect elevated
levels of volatility with the equity market spending much of its time range-bound (4,200-4,600). However, for longer term investors, we believe that we may be nearing peak levels of depressed sentiment and that fundamentals continue to suggest that equities should be higher over the next 12 months.
In times like this, we strip the emotion from investing and turn to fundamentals – because they ultimately determine where asset classes go in the long term. The following factors continue to provide the foundation for our outlook.
Muted recession risk
Assessing the business cycle is critical for equity investors. While areas overseas continue to struggle (e.g., Europe due to its proximity to Russia/Ukraine), domestic demand in the U.S. remains strong. The robust labor market (the U.S. has added about 600,000 jobs on average over the last six months) should continue to drive consumer spending and elevated capital expenditures (durable goods orders rose at the fastest pace in six months in March) also remains supportive of growth. In addition, a sustainable reopening and increase in services spending should also drive growth. This is consistent with commentary from Chair Powell at his press conference, as he acknowledged that the U.S. economy is “very strong and well positioned to handle tighter monetary policy.” We continue to place a low probability on a recession unfolding over the next twelve months or so.
Peak Fed hawkishness and inflation
Evidenced by Thursday’s market action, the trajectory for both Fed policy and inflation remain key drivers for both the equity and bond markets. With inflation rising at the fastest pace in 40 years, the market has priced in almost 275 bps worth of tightening in 2022 alone, which would be the largest amount of tightening over a 12-month period since 1994. In addition, another 50+ basis points of tightening is priced into mid-2023. However, as normalizing supply chains, building inventories and an expected slowdown in goods prices suggest that we are at peak inflation, we also believe that we are nearing peak hawkishness on Fed policy. As inflation begins to roll over, which we expect to see the beginning signs of in the April CPI report, we believe that the expectations for Fed rate hikes will begin to moderate. This should be supportive of risk assets and allow bond yields to decline moving forward.
Supportive earnings
Evidenced by the first quarter earnings season, corporate fundamentals remain solid. While the pace of earnings growth is moderating, our expectation of 9% EPS growth in 2022 remains above the previous 20-year average of 8%. And although we have seen some giveback this week, forward earnings estimates for both 2022 and 2023 remain over 2% higher relative to the start of the year. This is unusual, as earnings are historically revised lower as the year progresses. Positive earnings growth, combined with a 14% decline year-to-date in the equity market, has led to a nearly 20% contraction in the Next Twelve Months S&P 500 PE multiple year-to-date.
Corporate activity
With nearly record levels of cash on corporate balance sheets, businesses continue to return cash to shareholders through both dividends and buybacks. S&P 500 dividends are expected to grow 8% and buybacks are on pace to post nearly the strongest year on record in 2022. Peak treasury yields? The overshoot in inflation has led to an increasingly hawkish Fed and a substantial ramp up in rate hike expectations over the next 12 months. Expectations of tighter monetary policy have led to sharply higher interest rates. While yields historically peak at the end of a tightening cycle, the front-loading of the rate moves in this cycle is a bit unusual. The velocity of the rate increases over the last few months has been notable and is already starting to have an impact on the real economy. This is evident in the sharp declines we’ve seen in mortgage applications lately. This suggests to us that longer-maturity yields are near their peak and should start to stabilize/decline as inflation pressures ease and tighter policy begins to cool demand.
S&P 500 NTM P/E Ratio
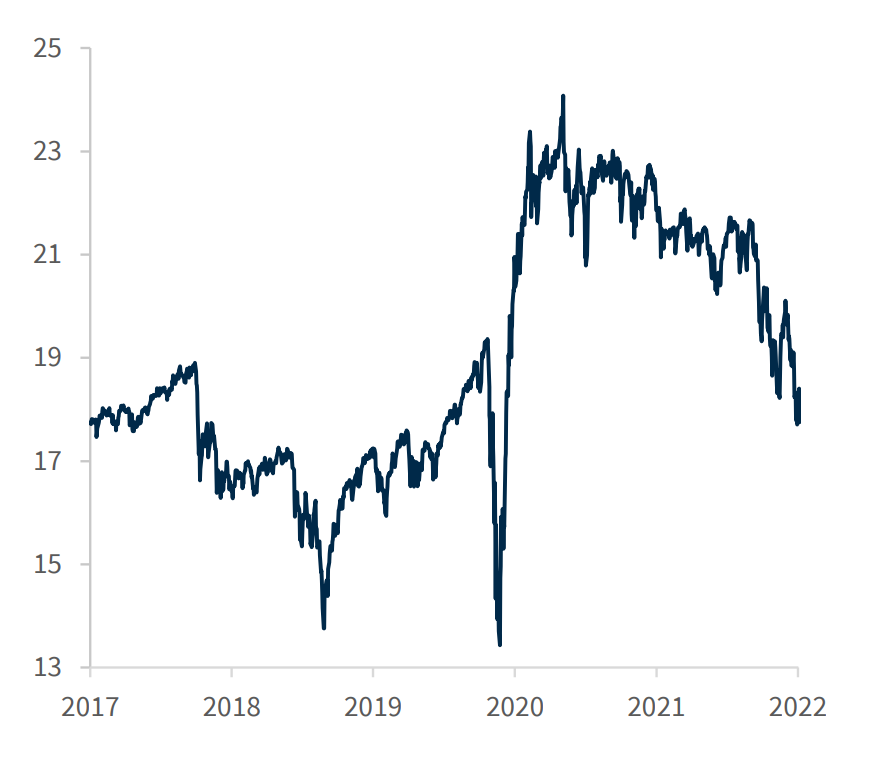
Source: FactSet, 5/5/22
The bottom line
The first two years of a bull market tend to lead to investor complacency as returns are robust and broad based. The third year tends to be different and defined by more volatility, muted returns and the need to be more selective. Thus far, this third year has been no different. In fact, while this downside volatility may seem extreme, it is worth noting that it really is an average pullback. The current 13% decline matches the average intra-year pullback that the S&P 500 has typically experienced dating back to 1980. What has made the recent downturn feel even worse is the fact that bonds have not provided the ballast they typically do during market corrections. While the losses on the fixed income portion of a diversified portfolio mix are painful, the silver lining is that the recent sell-off in bond market has put the “income” back in fixed income for investors, and there is now value in many sectors of the bond market. Although we expect volatility to remain elevated, we caution investors from panic selling as fundamentals continue to support a move higher from current levels over the next 12 months and the backup in bond yields has created opportunities for income-oriented investors.
All expressions of opinion are those of Investment Strategy and does not reflect the judgment of Raymond James and are subject to change. Information contained in this report was received from sources believed to be reliable, but accuracy is not guaranteed. Past performance is not indicative of future results. There is no assurance any of the trends mentioned will continue or that any of the forecasts mentioned will occur. Economic and market conditions are subject to change. Investing involves risks including the possible loss of capital. The Standard & Poor’s 500 Index (S&P 500) is an index of 500 stocks issued by 500 large companies with market capitalizations of at least $6.1 billion. It is not possible to invest directly in an index. Material is provided for informational purposes only and does not constitute a recommendation. The information has been obtained from sources considered to be reliable, but we do not guarantee that the foregoing material is accurate or complete. The Bloomberg US Aggregate Bond Index is a broad base, market capitalization-weighted bond market index representing intermediate-term investment grade bonds traded in the United States. Diversification does not guarantee a profit nor protects against a loss. Fixed-income securities (or “bonds”) are exposed to various risks including but not limited to credit (risk of default or principal and interest payments), market and liquidity, interest rate, reinvestment, legislative (changes to the tax code), and call risks. There is an inverse relationship between interest rate movements and fixed income prices. Generally, when interest rates rise, fixed income prices fall and when interest rates fall, fixed income prices generally rise. U.S. Treasury securities are guaranteed by the U.S. government and, if held to maturity, generally offer a fixed rate of return and guaranteed principal value.